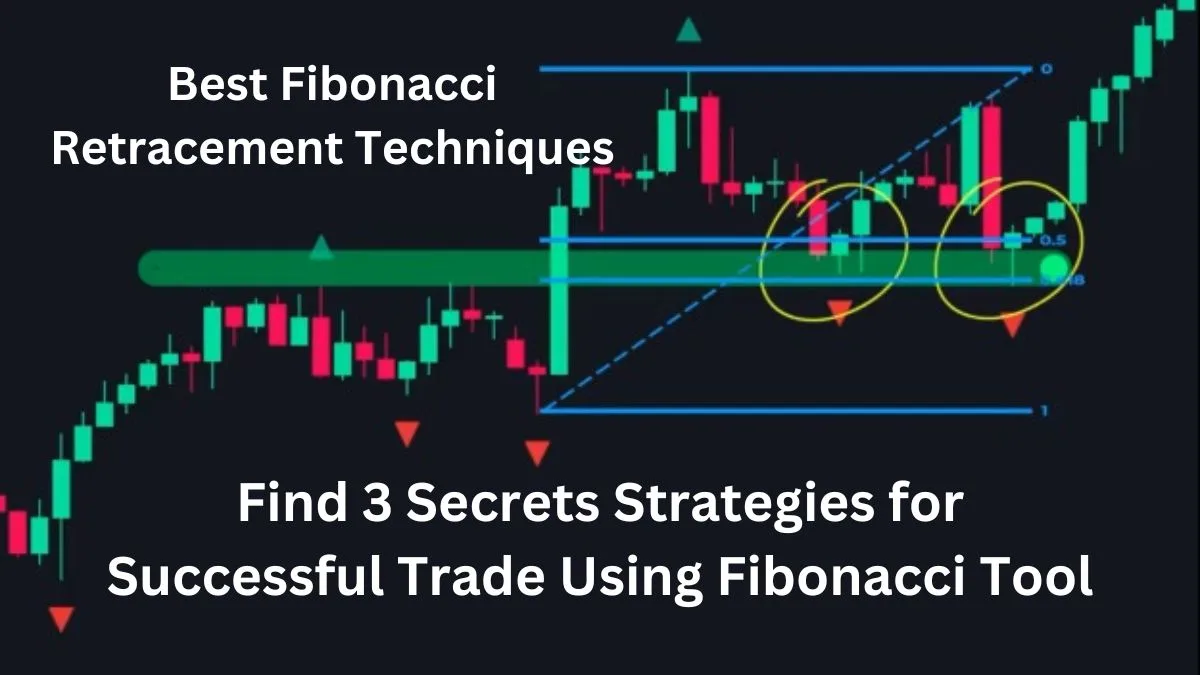
If you are a beginner in trading, and you must have tried using different technical analysis, tools, indicators and strategies. However, you failed most of the times in your trading. If this is the case, you want to try now one of the most effective tools called Fibonacci Tools for your trading. Using Fibonacci Retracement Strategy you can gain maximum profit in your trading. But you need to know how to draw fibonacci tools to find the golden zone and make probability trade entry and exit.
In this guide we will show you the profitable trading strategies using the fibonacci retracement tools. We will also reveal you our number one entry techniques for this strategy. Each entry technique will enable you to make strong entry with stoploss and larger target.
Introduction
Many traders use fibonacci tools but most use them incorrectly. The most confusing part about the fibonacci analysis is deciding the swing points to draw the fibonacci level.
We will reveal, our secret hack to remove all the guesswork and provide machanical framework to draw this level. Fibonacci tool is used mostly to identify the market price support and resistance with its retracement levels and impulsive move. In this course you are going to reveal everything about Fibonacci Retracement Strategy.
Here are the topics we will covering in this post:
1. What is Fibonacci
2. Fibonacci Retracements
3. Deep Vs Shallow Pullbacks
4. The Secret Hack
5. Fibonacci Retracement Strategy number one
6. Fibonacci Retracement Strategy number two
7. Fibonacci Retracement Strategy number three
8. Entry Trigger
First let’s begin by understanding fibonacci sequence.
1. What is Fibonacci?
Fibonacci is a number series that was discovered by an Italian Mathematician. Example, 1, 2, 3, 5, 8, 13, 21, 34….. each number on this series is calculating by adding the last two numbers. for example, 1 plus 2 is 3, and 2 plus 3 is 5 and so on.
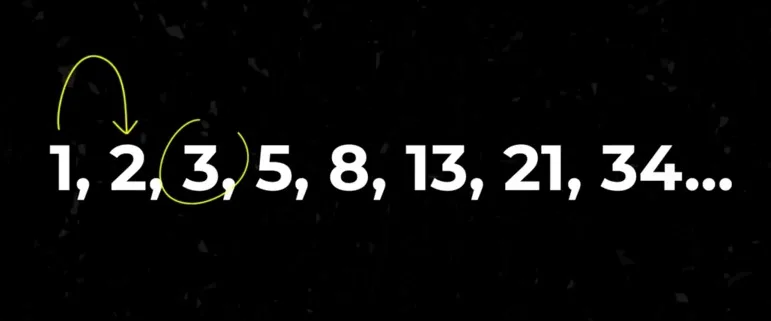
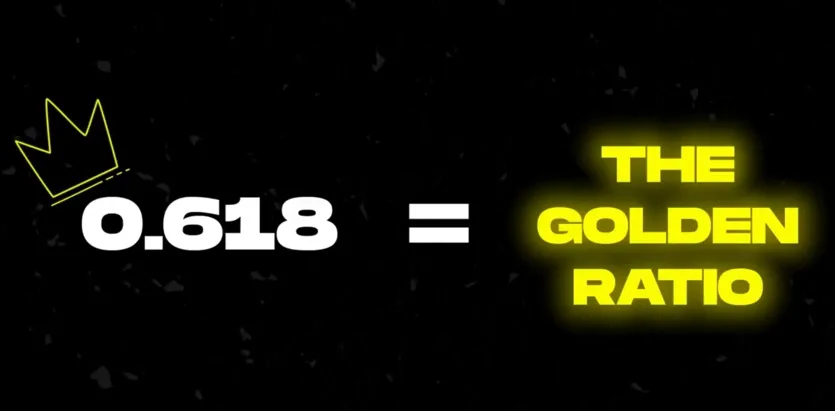
The first setting thing here is that if you multiply any number on the series by 0.618 you will get the prior number. Therefore, 0.618 is known as the golden zone ratio.
So, some traders thought of applying this to trading, and the result was astounding.
They discovered that the fibonacci golden zone ratio could be used to identify the start and end of the price move. Over the years traders have develop three techniques to achieve this.
#1. Fibonacci retracement,
#2. Fibonacci extensions, and
#3. Fibonacci projections.
Each of these techniques will explore in much details. For the purpose of this guide, we will focus only on the most popular technique, which is called Fibonacci Retracement. In addition to this we will also reveal three fibonacci retracement strategy.
Also read: How To Start Trading? 7 Steps For Successful Trading
2. Fibonacci Retracements
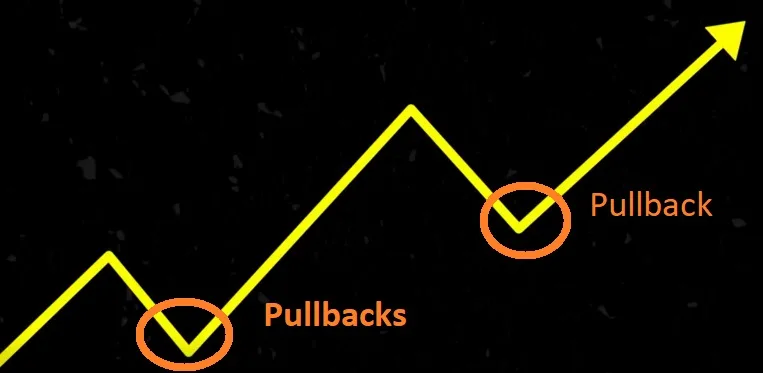
Let’s now understand fibonacci retracement. During the trending market, the price generally moves in a zig-zag pattern. We have a strong moves in the direction of the trend powered by pullbacks. This strong moves in a trend directions are also called impulsive moves. And an ideal entry can be made on the end of the pullback and start of the impulsive move. The fibonacci retracement tool help us to identify these entries.
Whenever we see a solid trending move, we need to plot the fibonacci retracement tool from the start to the end. This gives us three levels for we expected the price level to pullback. Look at the screenshot below:
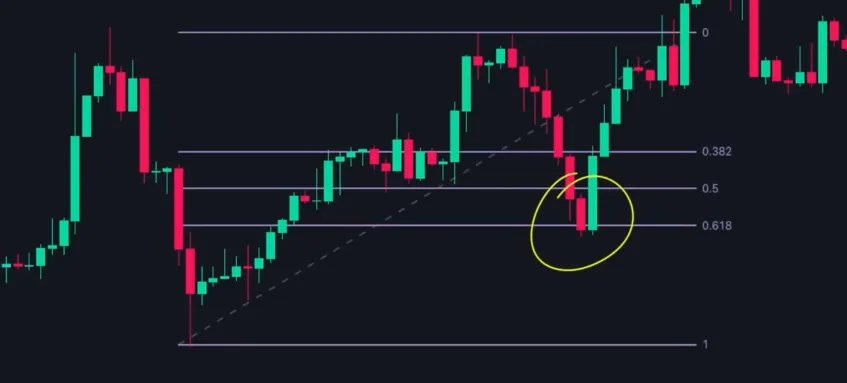
Lots of traders used different fibonacci levels for their trading. But through our experience, we have discovered that most pullbacks fall in three key levels.
Example of Opening a Buy Trade Using Fibonacci Retracement Strategy
To Open a Buy Trade:
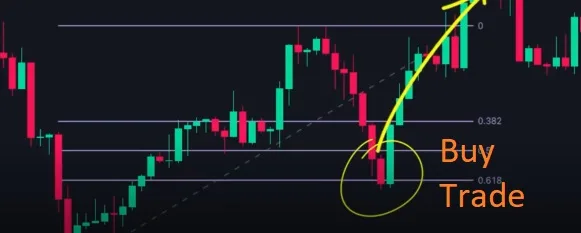
When we set the fibonacci levels from starting price to the ending price, and if the retracements happen from the ending price to down trend, we wait for the price move to hit fibonacci levels. Once the price arrive on the fibonacci level of 0.618 and retracements happen in up trend then we can expect the price to reverse and move to upwards. Therefore, here you can open a buy trade. Look at the screenshot:
To Open a Sell Trade:
Similarly, in a down trend, draw the fibonacci levels from the end of the impulsive price move to lowest price in down trend. Once the price move hit the fibonacci levels 0.3 or 0.5 levels and began retracements in down trend then we can expect the market price is moving in downwards again. Then we can go for sell trade entry.
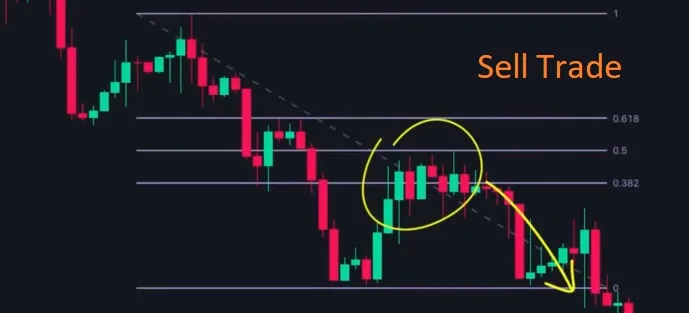
Here the three levels we see in fibonacci collectively are called fibonacci retracements. Let’s now learn each of these levels which is known as deep and shallow pullbacks.
Now you may ask me, ‘which platform do I trade with.” As for me I use OlympTrade for trading. If you have not create an account yet, then you can create an account and start trading on OlympTrade. Starting with Olymp Trade is very easy. However, if you are new to Olymp Trade, you should read this article: How to Be Successful on Olymp Trade?
3. Deep Vs. Shallow Pullbacks
Whenever the price pulls back to the 0.382 retracements level that shows the trend is strong. Every pullback is a thought of an opportunity for trade. There is a levels of excitement among traders to enter a trade.
Such strong trends are very rare. Most of the times the price will pullback to the other two levels (0.5 and 0.618). So, avoiding 0.382 levels for trade is a good idea.
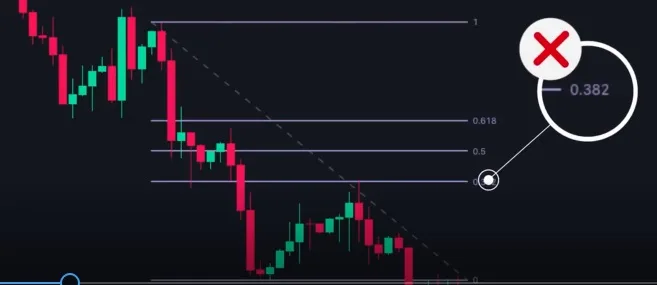
The area between 0.5 and 0.618 levels are known as golden zone. Typically, the price will pullbacks above the level area before reversing. A pullback to the lowest level indicates that the trend is matured, experiencing deeper pullbacks in price.
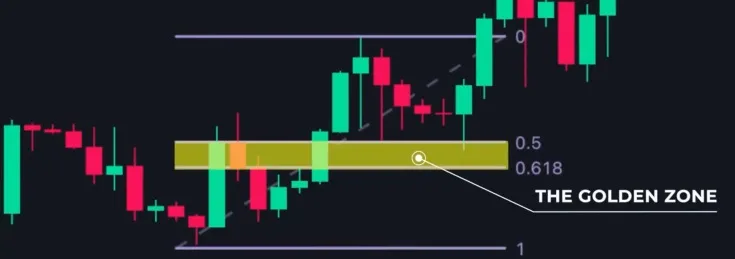
However, a mature trend does not necessarily indicate weakness. In fact, such trends can last for long time before reversing. At trade prime we only trade the pullbacks to these golden zones.
Now, rest of the tips, we will exclusively use ‘the golden zone’ for our trading strategy. Please remember this before going forwards.
As I have already mention earlier, many traders need help with determining the swing points to use when drawing fibonacci levels.
Now let’s solve this problem.
4. The Secret Hack
To solve this problem, we will use the simple indicator called Fractals. What is Fractals? The fractals is an indicator that helps to identify reversal points. The indicator plots arrows at the reversal points.
Fractals are of two types: up fractals and down fractals.
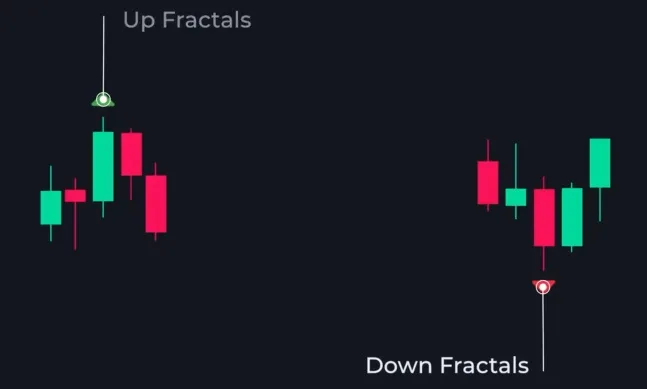
- Up fractals – is created when the high of a particular candle is higher than previous two and next two candles. It shows a bearish price reversals.
- Down fractals – On the other hand, a down fractals is created when the low of a particular candle is lower than the previous two and next two candles.This shows, a bulish price reversals.
To plot this indicators, go over to tradingview, and click on the indicator button, then type in fractals. And click on William fractals, and your chart should look like the one in the screenshot.
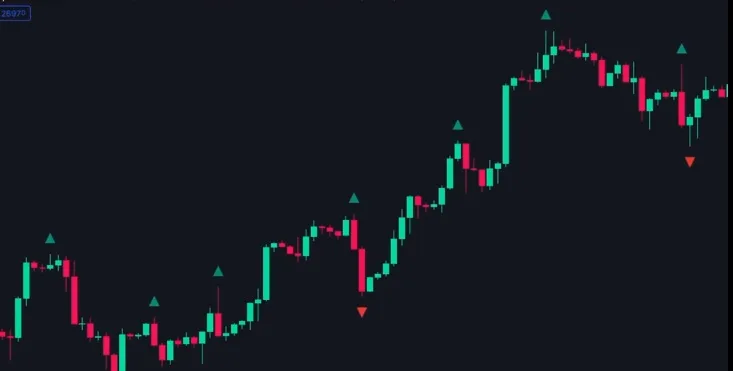
If we keep the settings to default, the indicator will plot every minor reversals. but that will confusing you more than solving the problems.
So, we will change the settings to 5 periods. To do that go to fractals, then select the inputs, change the periods to 5, then click ok.
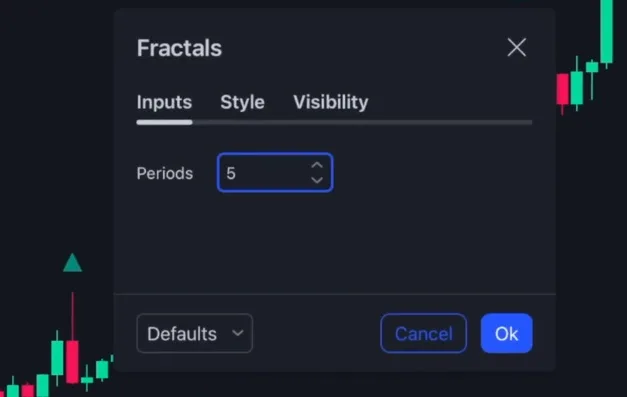
Now the indicator will mark only the strong reversals points. However, sometimes the indicator
will also marks irrelevant swing points. Therefore, you can use this indicator as a beginner. But, for your long term goal, should be to develop experience in identifying the major swing points without the indicator.
All you need to do now is, look for a trending market and draw the fibonacci retracements tool on in impulsive move.
Here is an example of up trend reversals:
Look at the screenshot of the chart. Here we see the price is in up trend, making higher high and higher lows. Then we spot this impulsive up move. The moves start from the down fractals and ends up at the up fractals.
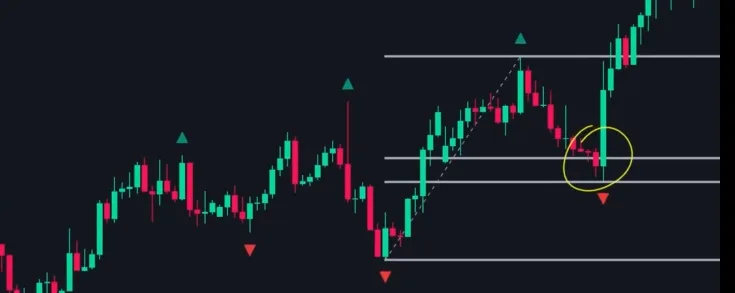
So we draw the fibonacci retracements from the start to the end. As you can see, the price then pullbacks to the golden zone and reverses upwards.
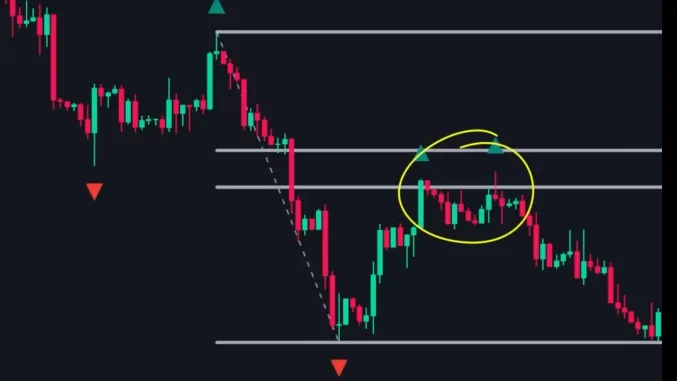
Here is another example of the down trend reversals:
Look at the screenshot of the chart again. Here we see the price is making lower highs and lower lows. So we consider the price is to be in down trend.
Then we spot the massive down low and draw the fibonacci retracements levels starting from the start to the end. As you can see in the chart, the price pullbacks in the golden zone and moves lower. So this is where we want to trade. We want to enter the trade on this pullbacks as early as possible using the fibonacci retracement tool.
But, important point is, we will not rely on fibonacci alone.
We will look for other confluences to identify high probability trade set up. Now we have covered the basics of fibonacci. It’s time to move on the advance strategies.
5. Advance Fibonacci Retracement Strategy
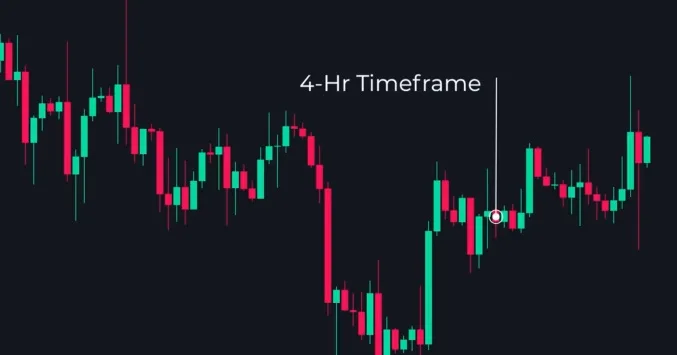
Now you may ask about timeframe. Here in this guide we use 4- hrs timeframe. So the chart as an example, you see in the screenshot are of 4 hrs timeframe chart.
Now come back to our strategies.
Strategy #1: Swap Zone Confluence
Swap Zones are one of our favorite techniques to add confluence to any strategy. What is Swap Zone? Swap Zones are nothing but are levels of support and resistance. When the price breaks the lower support levels that becomes a resistance levels.Similarly, when the price breaks above the resistance levels that become a support levels. Since this support and resistance swap with each other we called it Swap Zones.
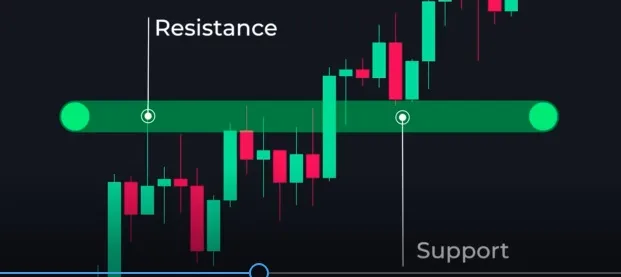
We will use this concept in combination with fibonacci retracements to identify trade opportunities.
Here is an example of buy trade entry using Swap Zone Confluence:
The price was in up trend making higher high and higher low. Look at the screenshot below. Here, the price makes a high and it pullbacks. We identify this point as resistance levels and mark it. Then the price breaks above the resistance levels and makes this impulsive move. Once the resistance is broken, it is now turn to a support.
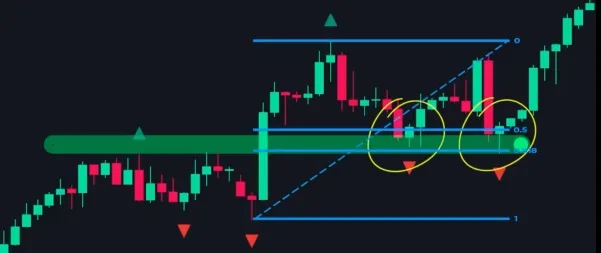
Now, you have to draw fibonacci retracements only on impulsive move.As you can see in the screenshot above that the golden zone of the Fibonacci retracements coincide with the support levels. Therefore, this golden zone acts here as double confluence. When the price pullbacks on this golden zone, then we will look for long trade entry using the techniques that we will discuss later in this guide.
Now let’s move on the sell trade or short trade.
Here is an example of sell trade entry using Swap Zone Confluence:
Whenever you see the market price is in down trend making a lower highs and lower lows. When the price is making reversal as seen in screenshot below, you have to make that reversal point as market’s support levels. The price then breaks below the support levels to make an impulsive down lows. The support has now turn into resistance.Now, you need to draw fibonacci retracements tool on the impulsive move. Then you will see that the golden zone and resistance have formed the confluence.
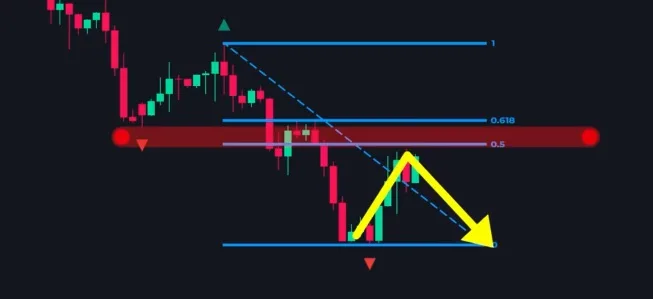
When the price return to the confluence area, you can expect the price to reverse and move downwards. And here you can see the price touches the golden zone and reversed.
Also read: How to Use Awesome Oscillator in Trading? 2 Simple Strategies
Now let’s move on to the next strategy.
Strategy #2. Moving Average Confluence
Moving averages are simple indicator with a lot of different uses. Once such use is that they can act as a dynamic level of support and resistance.
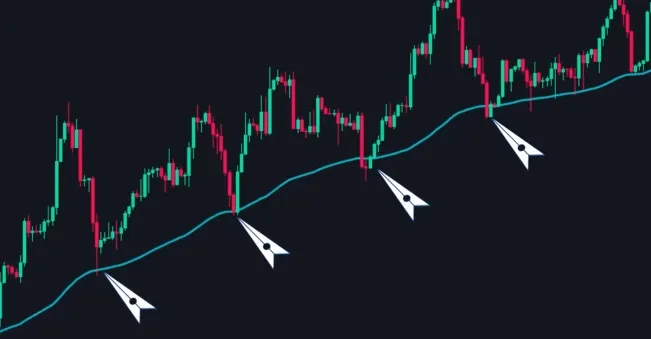
When the price is in up trend the moving average can act as a support for the price. Similarly, in a down trend, the moving average can act as a resistant for the price.We will combine this use with the golden zone to open high probability trade.
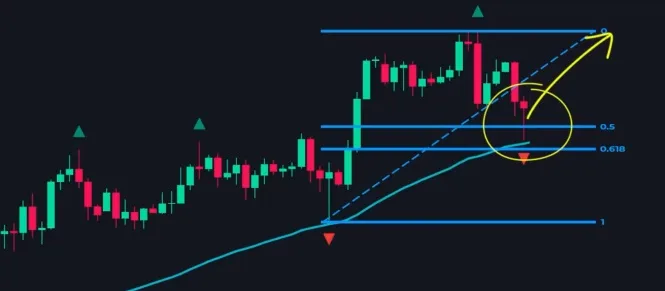
For this strategy we will use the 50 period Exponential Moving Average (EMA). Here is an example:
To Open a Buy Trade
When you see the price is in strong up trend, and as the price is above the EMA. And EMA was slot upward. In a up trend, we expect the price to find support at the EMA. Now, spot the impulsive up move, and draw fibonacci retracement tools on the impulsive area. Here you will see the golden zone coincides with 50 EMA. When the price pulls back to the golden zone, you can expect the price find support and move upward.
So, here you can enter a buy trade near the golden zone area. As you can see the price touch the golden zone and move to upwards.
Now let’s move on sell trade.
To Open a Sell Trade
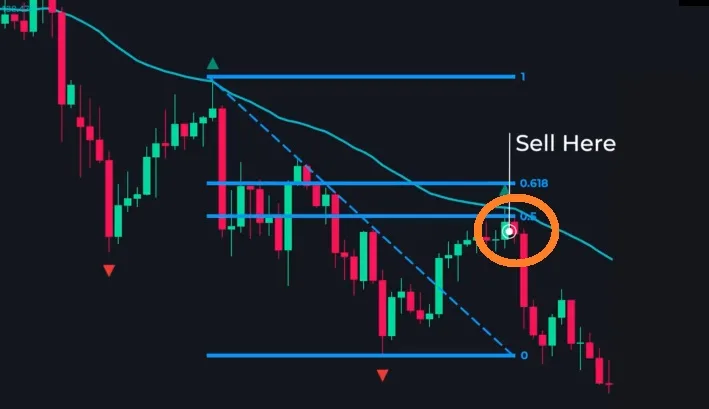
When you see the market is in strong down trend and the price is below the EMA, and EMA was slot downward. In a down trend, we expect EMA to provide resistance to the price. Then the price makes a strong impulsive down lows. There you have to draw retracement tool from start to the end, and you will see the golden zone coincides with the EMA (Moving Average). And wait for the price to pullback. When the price pullbacks near the golden zone, enter sell trade. As you can see here the price is moving downwards.
Now moving on to next strategy.
Strategy #3. Anchored Vwap Confluence
Anchored VWap Confluence is one of our favorite indicator at trade brand. We find it highly accurate in finding solid area of support and resistance.
Anchored Vwap is a tool that plots Vwap from a selected started point. By connecting moving average the Anchored Vwap can act as a dynamic level of support and resistance.
In a up trend, whenever the price falls below the anchored Vwap buyers will come in and push the price upwards.
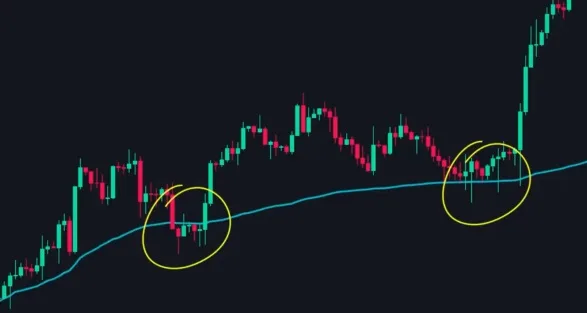
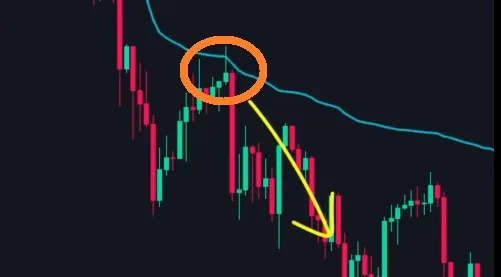
Similarly, in a down trend, when the price move on above the anchored Vwap, sellers will come in and push the price downwards.
To Open a Buy Trade Using Vwap Strategy:
Let’s combine this property with fibonacci retracements to identify strong trade. When you see the price is in strong up trend, then you will notice that the price is making a strong impulsive move towards up trend, now you will plot the anchored Vwap from the starting point of impulsive move to the end. Then you have to draw the fibonacci retracement on the impulsive move. Then the golden zone and anchored Vwap coincide in a price area which will act as a strong support level.
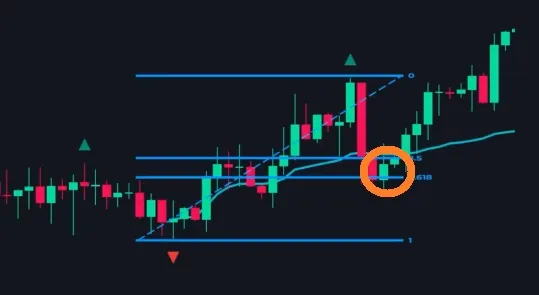
When the price pullbacks from this area, you can enter buy trade. As you can see in the screenshot, the price bounce from the golden zone and move upward.
Now, let’s move on sell trade.
To Open a Sell Trade Using Vwap Strategy:
When you see the market price is in strong down trend, and the price makes a strong impulsive down lows. Here you have to plot anchored Vwap from the start of impulsive move and also draw fibonacci retracements on the impulsive move. Here you will see the golden zone and anchored Vwap coincide in the price that will act as a strong resistance levels. When the price pullbacks from this area, you can enter sell trade. As you can see in the screenshot that a strong downfall follows.
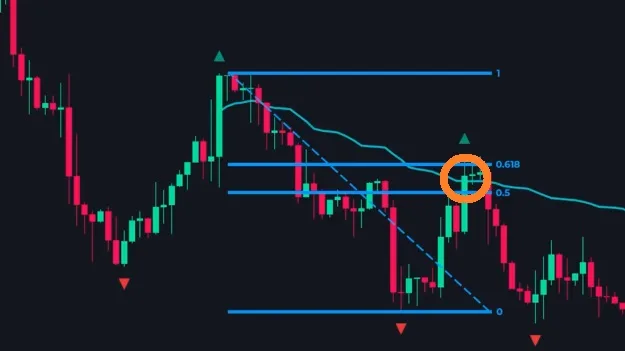
So, these three strategies will enable you to spot high probability trade opportunities using the fibonacci retracement strategy.
Now let’s discuss our entry technique to help you enter this opportunities.
6. Entry Trigger in Engulfing Bars
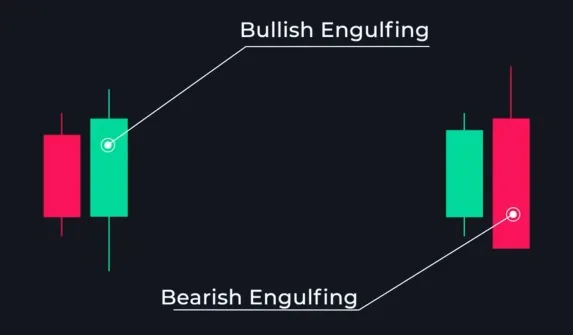
Engulfing bar is a two candle formation where the second candle engulfs the entire first candle. In others words, the high of the second candle is higher than the previous candle. Similarly, the low of the second candle is lower than the previous candle.
- Engulfing candle can be of two types: Bullish Engulfing Candles and Bearish Engulfing Candles. A bullish engulfing candle is green in color. It represents a bullish reversal in price. We look for this candle for buy trade.
- On the other hand, a bearish engulfing candle is red in color. It represents a bearish reversal in price. We look for such candle for sell trade. Look at the screenshot below as an example of bullish engulfing and bearish engulfing candles:
Here is an example of buy trade using the anchored Vwap confluence.
If the market price is in strong up trend, and the price is making strong impulsive up move and the price pullbacks. There you have to plot anchored Vwap from the start of impulsive up move, as the price starts to pullback,draw fibonacci retracements tool on the impulsive move. Then you will see the golden zone coincide with anchored Vwap.
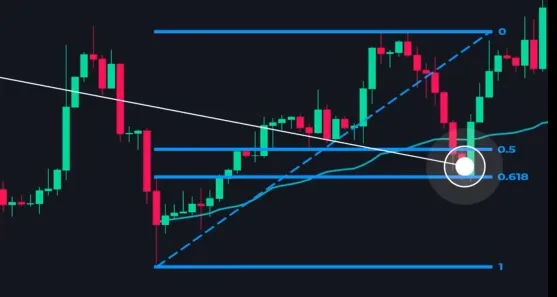
So, you can expect the price to find the support there. When the price is reaching to the golden zone it create a bullish engulfing candle. The big green candle covers the entire red candle.That’s a bullish engulfing candle, indicating the price is moving upward. so here you will open a buy trade.
Again here is another example of sell trade using the Swap Zone confluence.
To Open a Sell Trade Using Swap Zone:
When the price is moving in strong down trend, then spot the reversal point and mark it as support. Then the price moves lower, creating it as an impulsive move. The move broke the support levels and turn into resistance. Now draw the retracements tools on the impulsive move. And you will see the resistance zone coincide with the golden zone. So here we expect the price to face the strong resistance around the golden zone area.
When the price arrive in golden zone, it creates an engulfing candles. That signals downside reversal. There immediately, a sell trade could be initiated. And you can see the price is continuously moving on to downwards after the making sell trade. Look at the screenshot below:
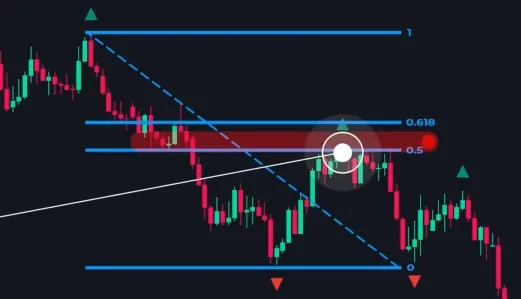
This is one of the candlesticks pattern we used in trading. There are many other candlesticks pattern you can find.
Conclusion:
I think I have covered almost everything about fibonacci retracement strategy. However, it is not possible to cover everything in one written text. You also need to watch some tutorial videos to help you understand more clearly. Whatever, I have discussed here are more of practical. As you read this you need also to look into all the screenshots.
What we have learn here are the concept of fibonacci retracements and its practical steps to use in trading. Fibonacci retracements tools are very powerful. If you know how to use it with the combination of three different strategies that we have discussed on this guide, you can become a successful trader. You will gain maximum trade profit using this techniques and strategy.
But before using it on to your real trading, practice with demo account. Once you are sure of winning profit using this strategies and techniques then you can go for applying on your real trading. You can also watch all our trading strategy tutorial videos on the Playlist in our YouTube channel.

