The ICT trading strategy, short for Inner Circle Trader, is currently a big deal in The Strat community. Traders mostly follow price action, while trend following and momentum indicators are barely used. This piece will detail the basic ideas of the ICT strategy to help you apply them in your trading.
Introduction to ICT Trading Strategy
The essential elements of ICT trading are: Institutional Order Flow Analysis, Market Structure Evaluation, and Price Action Interpretation. Understanding and using these notions can give Forex traders an upper hand.
Understanding ICT Trading Strategy in Forex
The term ‘ICT’ might be new to you or you might have encountered it on forex trading sites, blogs or online communities.
The term got familiar in the last couple of years, although it’s been used in the trading sector for many years.
ICT stands for Inner Circle Trading.
This trading entity belongs to Michael Huddlestone, a celebrated trader with over two decades of market experience.
The pioneering methodologies and strategies of ICT trading really made waves in the online trading space when they first appeared.
Before this, trading mostly revolved around technical price action traders, fundamental traders, and supply and demand strategists.
ICT tactics successfully integrate diverse aspects smoothly.
The tactics primarily focus on securing top deals. Following what Michael deems as market driving forces is achieved using institutional footprints in the markets.
Scheduled implementation of these tactics is key to high trade volumes. This ensures the price can shift quickly. ICT traders have a favored time to trade, known as the “killzone”.
At its core, the methods use supply and demand. But they do so in a way smarter than ever seen in the retail industry.
In theory, this is wonderful. We’ve seen traders claim expertise in this area, but ICT is the first to substantiate their claims.
Also read: How To Start Trading? 7 Steps For Successful Trading
What’s The Origin of ICT Trading Tactics?
Over the years, ICT-style trading has gained much attention. Michael consistently shares considerable value on YouTube.
In time, this grabbed the interest of top ‘influencers’ in the digital trading world. These influencers left support and resistance-based tactics to learn from Inner Circle Trading.
This has led to ICT trading becoming recognized among online retail traders. Thousands are now eager to learn these tactics.
Michael has uploaded thousands of YouTube videos, trading different sessions and earning substantial profits with precise market predictions.
Many traders were attracted to this trading method because of its accuracy and clear understanding of how banks move money in the forex markets.
Where Can You Learn The ICT Trading Style?
You may be asking yourself where you can learn the ICT trading ways. Luckily, you have some choices for places where you can actually learn from! One good choice is to learn directly from Michael at Inner Circle Trading. After all, he created this logic and ways of thinking. So it’s smart to learn from him! It takes traders a very long time to learn and use Michael’s methods in the markets. His lessons are not broken down into easy parts to understand. You have to work hard to see how you can use what he teaches when trading.
Another choice is to learn from some of Michael’s students who made money trading and made their own classes.The idea is that teachers have already made all the same mistakes you will make and can teach the class in a easier way to understand. Ultimately, learning directly from computers will probably be the best thing to do, but it won’t happen very fast.
Also read: How to Do Intraday Trading? Using 10 Easy Strategies
Is ICT Trading Profitable?
The big question – does the ICT trading strategy really make money? Well, but there is no straightforward answer to this question. The things Michael teaches are more ways of doing things than real plans, not whole strategies most of the time.
Traders spend a lot of time looking at information and trying to understand it to make a plan to make money trading. They need to read everything carefully and think about what it means put together a trading strategy that will be successful.
The main idea is that using ICT trading strategy can make money for some people who trade but will not make money for a lot of traders. Learning a way to trade that some people think uses feelings or human work will always cause different results for different traders. Trader A will usually have outcomes that are a little different from Trader B.
It is good to use ICT methods if you make them better, test how they did before, and learn about them for a long time. If you think you can copy someone else’s plans and start making money right away, that will not happen.
Powerful ICT Trading Tips
If you follow the ICT swing trading plan, have self-control, and are calm, people can do well in Forex trading and maybe stop working their jobs.
Timing and Market Analysis
- The ICT trading strategy focuses on finding low and high prices on the weekly chart. This helps understand if the market will go up or down.
- The strategy says the weekly and daily charts are important. It wants to see when the market changes and take advantage of the opportunities.
- Spotting the hidden low price in the weekly range is very important for swing trading to do well.
- Usually by Wednesday in the New York session, the market manipulates the weekly range. This shows which way the market will really go.
- Looking for a change in the market structure and then waiting for a drop is a good start. Then you can purchase at a lower cost.
- Trading success comes from timing. This means using the low Judas price, market structure, and missed liquidity.
In this approach, timing is everything. Traders look for specific candle patterns and weekly lows. This helps them manage their trades.
Enacting Trading Strategy and Controlling Emotions
- It is hard to find a plan that gives good reward with a high chance to win, so this plan stands out.
- Thoughts like not having self-control and patience can hurt how you use a plan with a high chance to win money. This shows it is important to control your feelings when trading.
- The money not used yet in ICT trading gives a strong plan to maybe trade full-time.
- Swing trading can work well for people with a full-time job. It gives good reward for risk and high chances of trades.
With enough self-control, patience, and following the rules, this trading plan can help you quit your job. It can give you money freedom.
What is the ICT Trading Strategy?
The Inner Circle Trader (ICT) Trading Strategy teaches how markets work. It shows what big traders do. This strategy helps people avoid common issues traders face, like unexpected losses. It carefully studies how markets work and evolve. It lets traders follow the steps of knowledgeable big traders. Then, they can make better decisions on when to buy and sell.
The ICT trading strategy knows how the market operates. Financial markets, big players collect plenty of orders before big price changes. This is mostly true in forex trading, where central banks frequently participate. During this collection period, prices often remain within a certain range, breaking short-time highs and lows. However, a key takeaway from the ICT method is identifying the exact moment when the order flow begins.
For the ICT trading strategy to succeed, traders must understand the mechanics of money markets. They operate all the time, beginning with Asian nation’s trade cycle. This allows traders to track price changes throughout the day. It enables them to seize good trade times when prices are optimal. Later, London and New York trade periods wrap up a complete market day.
A lot of trading strategies are based on the ICT concept. Each strategy is unique. Interestingly, most profitable strategies take into account both short and long-term price shifts.
Take swing trading as an example. Traders pay keen attention to the weekly buy-sell pattern charts. This aids them in identifying prime trading moments, often visible in daily or 4-hourly patterns.
The other approach focuses on the daily dynamics. It leverages insights about public sentiment and the ideal trading duration, assisting traders to find the most opportune moments to trade, especially after London traders have influenced prices.
Also read: How to Use Awesome Oscillator in Trading? 2 Simple Strategies
Key Concepts of ICT Trading
ICT trading is a method based on several vital principles that traders need to grasp for optimal success. The ICT trading technique hinges upon these seven critical components. In subsequent sections, we will delve into these key ideas and how to put them into action.
- Liquidity
Liquidity holds a significant spot within the ICT trading strategy. There’s buy-side and sell-side liquidity. Buy-side stands for a point on the chart where short sellers place their stop orders. Sell-side, on the contrary, marks the point where traders with a long bias set their stops. Typically, these points are located at or near peaks and troughs of the chart.
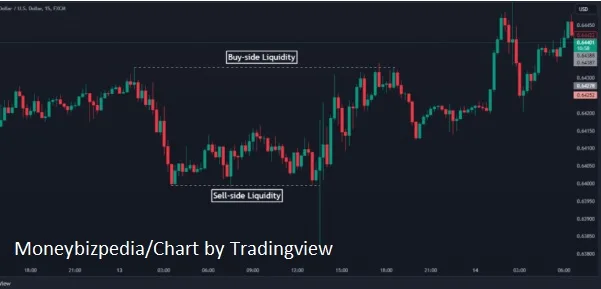
Often, traders view ranges as areas of mistaken judgement, where they desire to escape their trades.
Those who handle ‘smart money’ get this idea. They usually amass or spread out positions near points full of stop-orders. This heavy amount of stop-orders at key levels enables a large player to fully take up their position. Once a level holding many stop-orders is traded through, the price usually reverses and heads the other way, looking for liquidity on the other side.
- Displacement
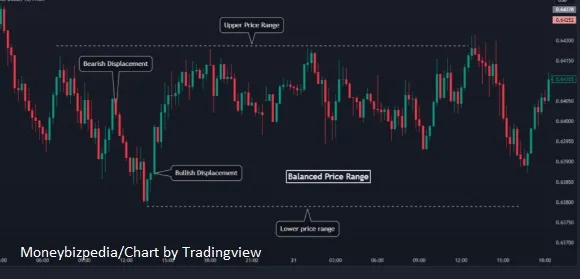
Simply put, displacement is a strong price action move causing intense selling or buying pressure. Displacement usually shows up as a single or series of candles all pointing in the same direction. These candles often have big real bodies and short wicks, showing little disagreement between buyers and sellers.
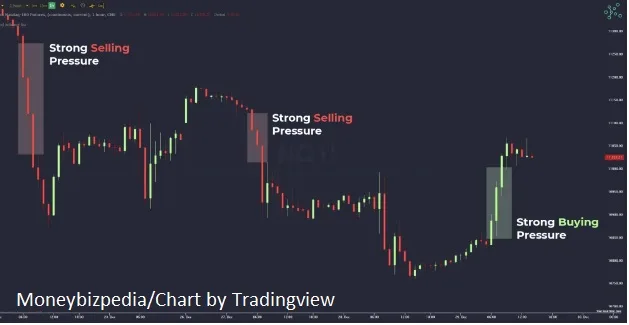
Usually, displacement appears just after breaching a liquidity level, creating both a Fair Value Gap and a Market Structure Shift.
- Market Structure Shift
Trends are marked by higher peaks and valleys in an uptrend and lower ones in a downtrend. A Market Structure Shift indicates a level in the chart where the ongoing trend is interrupted. In an uptrend, it’s marked by a lower valley, while in a downtrend, a higher peak typically signals it. These shifts usually follow a Displacement.
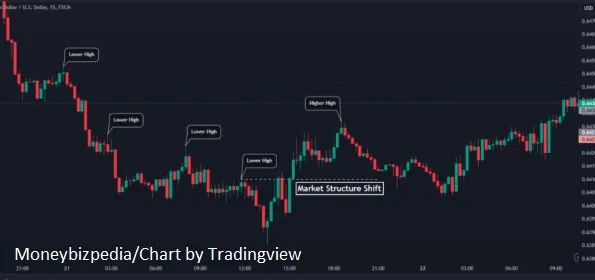
After prices push through a Market Structure Shift level, Inner Circle Traders start searching for other signs. These signs would tell them the trend is shifting. This level is a guide for making trades.
- Inducement
Price rarely travels in a straight path. Even in a major trend, you will find moves that go against the trend. These against-trend moves are lower timeframe attempts to find liquidity. Prices dodge and rebound, targeting a recent high or low before moving with the major trend again. That’s what inducement is all about – it targets those recent highs or lows, the places where traders may have set stop orders.
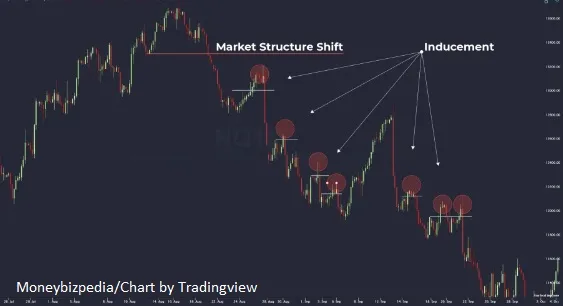
Where stop orders are bunched up, that’s where liquidity gathers. When these stop orders are hit, the price can follow its previous direction. Chart pattern traders might recognize Inducement in the making of bull or bear flags.
- Fair Value Gap
After price achieves a liquidity level, then pivots, Displacement often happens next. Fair Value Gaps occur during displacement. They’re seen when the market isn’t balanced. We spot these imbalances on a chart: a sequence of three candles. The middle one is big with two small ones at its sides— none of them overlap.
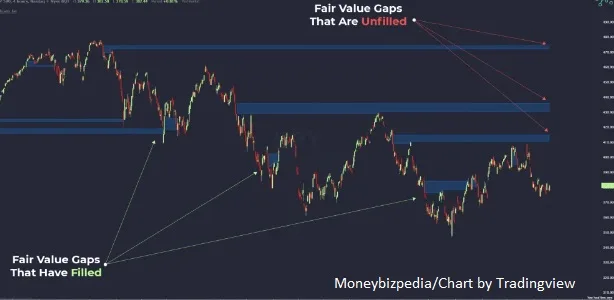
Fair Value Gaps attract many traders. They often act as future price magnets.
- Effective Trade Entry
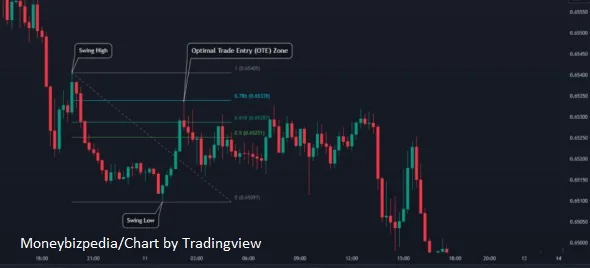
ICT traders use Fibonacci levels to select effective trade entry points. It happens after an Inducement sparks a Displacement. This, in turn, leads to a Market Structure Shift and a Fair Value Gap. The entry points mostly fall within 61.8% to 78.6% retracement of an expansion range.
- Stable Price Range
A Stable Price Range is limited by two Fair Value Gaps. They’re caused by two opposite Displacements in a short time. While in a Stable Price Range, prices usually bob within a certain span. They aim to fill both Fair Value Gaps by testing both ends. ICT traders actively engage with this volatility. They predict that the price will likely go back to its original trend after breaching the Stable Price Range’s boundaries.
Using ICT Trading Strategy to Formulate Price Predictions
ICT trading strategy offers various setups, simple to complex. As trading is uncomplicated, we’re highlighting the Liquidity Sweep Strategy – the easiest and most effective ICT trading technique.
The Liquidity Sweep Strategy revolves around the interaction between sell-side and buy-side liquidity. When a sweep swiftly clears sell-side liquidity, it paves the way for the price to head toward buy-side liquidity. It typically aligns with the ongoing direction. This move often sparks a major shift in the market sentiment.
In less complex ICT setups need waiting for cost reduction or recognizing buy-and-sell areas. In contrast, the Liquidity Sweep Strategy works quickly. It takes immediate action when bullish or bearish market patterns are spotted. This is how it functions:
Step 1: Find a Clear Single Candle Liquidity Sweep Pattern on HTF
Starting out, it’s key to find a clear single candle liquidity sweep pattern on the higher time frame (HTF). In a rising market, it shows as a lone candle clearing out cash below the previous low. This happens right before a fast, major upward move. And remember, this lone candle body or wick must jump below the lowest point of the last structure.
If this pattern is real, the next candle won’t go beyond or close under the sweep candle. Otherwise, the setup won’t count. It’s the opposite for a falling market pattern.
Step 2: Focus on Lower Time Frame and Wait for a CHoCH
After the single candlestick clears the liquidity, it’s time to switch to a lower time frame (LTF) and wait for a change of character pattern (CHoCH). When it appears, the market structure has changed on your entered time frame.
You can act on this information by setting limit orders. Whether you choose the new order block or the fair gap depends on you. Some traders might test out both methods and see which suits their style. Or, they might combine the two. They might view the fair gap and order block as one zone and find a middle ground for entry.
Step 3: Where to set your Stop Loss and your Profit Goal
In a rising market, set your stop loss below the order block. In a falling market, it belongs above the order block. Always give some room for spread to lessen any negative slippage.
As for your profit target, aim for the next swing point against the current price trend. Doing this provides a definite goal and allows you to capture gains once the market trends favorably.
Also read: What is Swing Trading? 7 Best Swing Trading Strategies
Benefits and Drawbacks of ICT Trading Strategy
Navigating financial markets can be tough. However, a well-structured trading strategy can guide your way, helping you to spot opportunities amid the ever-present volatility. We’ve seen significant changes within trading due to advancements in information and communication technology (ICT). This has led to efficient platforms, insightful charting methods, and intricate algorithms, evolving the trading landscape. We will now discuss some of the top trading strategies that utilize this technology to gain market advantages.
1. Moving Averages Crossover
This trading strategy is quite popular. It uses changing averages. Traders use it to spot possible trend reversals. It investigates how short-term averages overlap with long-term averages. Then, it’s up to you to make a trade!
Top Features
- It matches short-term average with long-term average to pinpoint trend changes
- Generates trading signals when averages intersect
- Adaptable and works across different timeframes and assets
Advantages
- Good at picking out momentum changes and trend shifts
- Gives clear, objective ‘buy’ and ‘sell’ signals
- Commonly used and simple to add to your strategy
Drawbacks
- During periods of market consolidation, it could give you misleading signals
- It asks for fine-tuning of moving average parameters
- In a suddenly moving market, it might have some delay
Because it’s so straightforward, the ‘switching averages crossover’ strategy is handy for any trader. By tweaking the time periods used, you can tune the signals for a range of market conditions.
2. Bollinger Bands
Bollinger Bands are a volatility indicator. Traders use them to spot when a stock is ‘overbought’ or ‘oversold’. The Bands are composed of three parts—an upper band, a lower band, and a middle one—that’s a plain moving average.
Main Features
- Bands tighten or loosen reflecting market volatility
- Traders watch for bounces away from the top or bottom bands
- RSI could be mixed with other indicators.
Pros
- Adaptive strips point out times of high and low volatility.
- They shine a light on support and resistance zones.
- These bands work as dynamic price paths for a security.
Cons
- There might be too many false alarms if settings aren’t finetuned.
- It works best for securities with unvarying volatility cycles.
Bollinger Bands flex with changing volatility and help traders verify breakouts and spot overstretched markets ready for reversions. Adjusting the standard deviation multiplier can lessen false signals.
3. Relative Strength Index (RSI)
RSI is a momentum gauge that checks the size of recent price shifts to consider if an asset is overbought or unsold. Traders use it to find possible trend reversals or continuations.
Key Features
- Varies between 0 and 100 percentile scale.
- Overbought above 70 and unsold below 30 by tradition.
- Discrepancy with price can foresee trend shifts.
Pros
- Finds tired trends and reversals in waiting.
- Helps confirm trend power during breakouts.
- Easy and clear oscillator works across all markets.
Cons
- Captures false signals if thresholds aren’t fine-tuned.
- Discrepancies may not lead to reversals fast.
The RSI is a must-have momentum indicator for spotting approaching trend exhaustion. Tweaking the overbought and unsold bands can lessen wrong signals. It’s advised to use RSI with more indicators to improve trade timing.
4. Fibonacci Retracement
Fibonacci Retracement is a tool in technical analysis. It uses straight horizontal lines. These lines help find key support and resistance levels. Traders use these to decide when to start or finish trades.
Main Points
- Important levels include 23.6%, 38.2%, 50%, 61.8% and 100%
- Can identify potential areas of pullback/bounce
- Can work with other indicators
Advantage
- Clearly outlines support and resistance zones
- Key ratios work over different timeframes
- Simple, visual tool that works with most securities
The Downside
- Exact levels may not hold exactly
- Other traders target the same zones
The Fibonacci retracement is widely used to forecast possible areas of reaction. It can be mixed with candlestick patterns to confirm bounces. Adjusting beyond standard ratios can reveal hidden levels.
5. Ichimoku Cloud
Ichimoku Cloud is a thorough trading method. It gives traders data about trend, momentum, and support and resistance levels. It’s made of many lines and “clouds.” These make it easier for traders to see potential trading chances.
Main Points
- Combines many indicators into one layered view
- Cloud levels reveal support/resistance zones
- Gives trading signals from line crosses
Pros
- Merges trend, momentum and price info in one display
- Cloud visual explains shifting support/resistance
- Easy to understand signals
Cons
- Adjusting parameters might be confusing
- Need extra confirmation for signals to work well
Ichimoku Cloud covers security status over time. Breaking down the elements improves its efficiency. Combining signals and momentum oscillators could offer better performance.
Watch Japanese Ichimoku Cloud Strategy Short Video:
6. Japanese Candlestick Patterns
Japanese Candlestick Patterns let us use shapes and colors to find trading chances. Each candlestick covers a certain time period. The shape and color tell us about price changes within that time.
Key Features
- Box-shaped candlesticks with differing parts
- Patterns can forecast trend changesVaried types like
- Doji, Hammer, Engulfing, Harami, etc.
Pros
- Helps spot likely good trades through visuals
- Shows sentiment and momentum switches
- Main patterns apply to all markets
Cons
- Single patterns may not offer significant edge
- Needs context and indicator confirmation
Japanese candlesticks display price changes visually. Pairing candlestick signals with indicators, zones of support/resistance, and other patterns boosts prediction accuracy for trades.
7. Trend Following Strategies
Trend following strategies mean finding and trading with the way prices are moving most of the time. Traders use charts and tools to see trends and trade that way. They look for things like prices going up or down over time on charts. They also look for patterns in how prices move.
Key Features
- Go with the flow
- Profit from long rides – not flips
- Works with various timeframes
Pros
- Catch big market waves
- Makes trading decisions simple
- Plenty of versions – pick your preference
Cons
- May enter late or exit early
- Risk of extended losses during market fixes
Trading with the trend? It’s a key rule for many winning traders. Swift exits when things change helps save profits in rocky times.
8. Scalping
Scalping means making many small trades in a short time to earn a little money each time. Traders watch charts and technical signs to find quick chances to buy low and sell high.
Key Features
- Trades held for very short times like seconds/minutes
- Usually try for 0.5% profit or less each time you trade
- Don’t like to take much risk and trade things very often
Pros
- Quick and exciting way to trade
- Can make money faster by borrowing money to buy more
Cons
- Trading a lot can make you tired
- It’s important to be careful with how much money you risk so you can keep trading for a long time
- You might miss chances to trade when you take breaks from the markets
Scalping gives exciting trades for traders who want to pay close attention. It moves fast so traders must follow rules to control risks and their feelings. Technology can help traders find good times to trade.
9. Pairs Trading
Pairs trading finds two things that are often priced close together but now cost differently for a little while. Traders buy one thing and sell the other at the same time. They hope the prices go back to how close they usually are. Then the traders can sell the expensive thing and buy the cheaper thing to make money.
Key Features
- Find instrument sets with strong past connections
- One that does poorly for a long time and one that does better for a short time
- Stop when their difference gets back to average
Pros
- Works in any market condition with lower chance of big losses
- Strategy not based on company details
Cons
- You have to pay a lot if you borrow money to invest and the investment does not go well.
- Pairs trading helps get rid of risk from the overall market by only paying attention to small price changes between two related assets that usually go back to normal soon.
To measure how closely paired two things are needs hard work with numbers and statistics so you can keep doing it the right way.
10. High-Frequency Trading (HFT)
Day trading with computers does many trades very fast. It uses powerful computers and tricky math steps to quickly buy and sell on stock market system. These traders try to make money from small problems in the market that do not last long. They watch how long it takes to trade on different market assets and trade faster than others.
Key Features
- Very fast connectivity to financial markets
- Advanced math formulas using step-by-step instructions
Pros
- Very small time periods separate little mistakes
- Much quicker than how long it takes a person to react
- The situation is changing as machine learning gets better
Cons
- It is very expensive to build the technology needed for space.
- There could be too many people and signals can get mixed up.
HFT finds new ways to trade very quickly between different groups buying and selling. It makes money fast but must always get better fast. Others will copy good ideas, so it needs new ideas all the time to keep making money at the very front of trading.
Implementing the ICT Trading Strategy
For the ICT trading strategy to work well when buying and selling things, people must follow some clear steps:
- Look closely at orders from big companies, how the market works, and price moves over different times.
- Make clear plans with rules for getting in and out of trades based on what you see happening.
- Follow your plan and be patient when making trades. Don’t let feelings make you act without thinking.
- Keep learning about what is happening in the market. Get better at trading and change as market conditions change by always learning and practicing.
Conclusion
Learning how to use the ICT trading strategy takes time and effort. If you understand the main ideas and use them right, traders can feel good dealing with the difficulties of the Forex market. They can then reach their money goals.
Frequently Asked Questions
What is ICT trading?
ICT trading looks at how big groups like banks place orders, how the market is set up, and how prices change to make good choices about trading money in the Forex market.
How does institutional order flow analysis help traders?
Looking at how big groups place orders gives clues about how people feel, how easy it is to trade, and what prices may do next. This can find good chances to trade.
Can beginners use the ICT trading strategy?
Yes, beginners can use the ICT trading strategy by learning the main ideas and trying them step-by-step with practice and self-control.
What are common problems when using the ICT trading strategy?
Common problems include making sense of complex market data, staying disciplined when placing trades, and keeping up with changing market conditions.
How can traders keep updated on market changes while using ICT trading?
Traders can keep updated by always learning, joining online classes, talking in trading groups, and following trusted sources about money.

