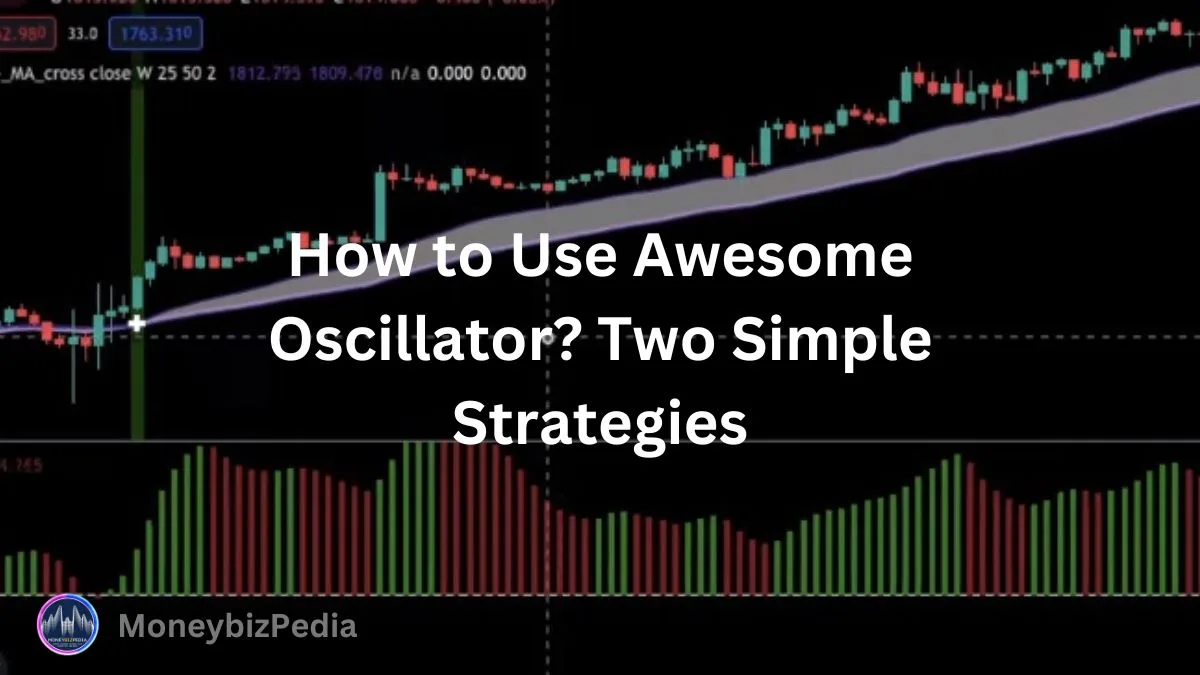
Hey traders! Welcome back to Moneybizpedia. If you are reading this, I assume that you are a trader. Whether you are a beginner or average trader or expert trader. Doesn’t matter! But you are a trader. If you are used to trading, you must have Hey traders! If you are used to trading, you must have heard about the awesome oscillator! Cool name, right? Have you used awesome oscillator ever in your day trading? Here I am going to reveal two simple strategies for gaining maximum profit using awesome oscillator.
May be you have used several times but it did not help you gain profit in your trading. Of you have not use once, you have no idea about awesome oscillator, this is first time you are hearing about it.
But don’t worry, if it is the first time you are learning about it. Because in this guide, you are going to learn two supper simple strategies to use awesome oscillator. I will show you two really simple and yet profitable strategies to trade with the awesome oscillator. But before we dive into the strategy, please don’t forget to subscribe our newsletter for more tips and guide on trading, business, finance, tech, markets and investment and the like.
How to Use Awesome Oscillator in Trading? 2 Super-Simple Strategies for Day Trading
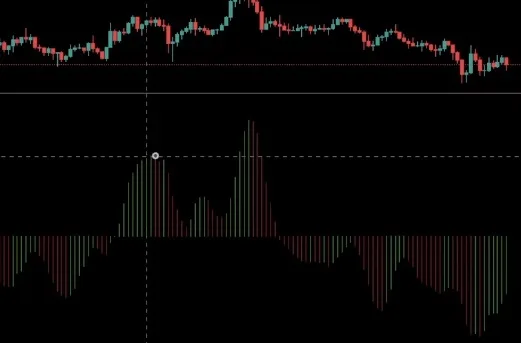
Before we start with our tutorial, let me give you a short explanation about the awesome oscillator. So that you will have more clear understanding before you use it.
What is Awesome Oscillator?
The awesome oscillator is a popular indicator that is used to evaluate the market momentum. It compares the momentum of the last 5 candles with the momentum of the last 34 candles. Its most common use is to confirm the trends.

It states a possible positive trend when the histogram breaks above the zero line, and it indicates a possible negative trend when it breaks down the zero line. Some of you might think that it can be profitable to buy every time it breaks above, and sell every time when it drops below. But remember what I always tell you, never trust a single indicator without a confirmation. If used properly, the awesome oscillator can be profitable like other indicators.
Two Supper Simple Strategies for Using Awesome Oscillator
So, in today’s guide, I will show you 2 different strategies you can use with the awesome oscillator. I will try to make it very short. So that you don’t feel overwhelmed when you are reading this. Okay fine! Now, let’s dive into the lesson! For our learning purpose, here we will take tradingview.com for technical analysis.
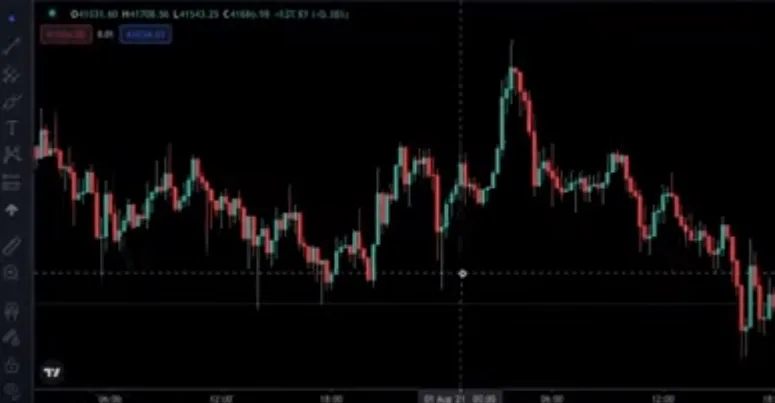
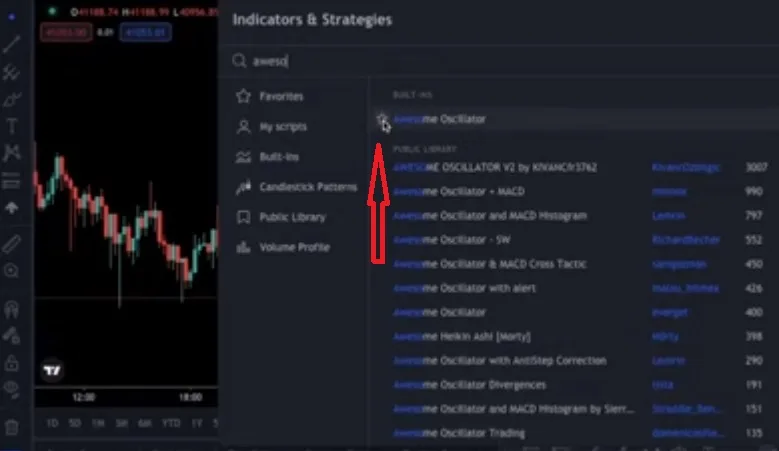
You can use another charting platform if you want. After opening the chart, we must add the awesome oscillator. To add the indicator, I will go to the top bar, and click the indicators icon here. You can search for it, and select the star icon next to it to add it to your favorites. Follow the screenshot below:
Chasing market momentum
Now, I am checking the 15-minute chart of the bitcoin to USD pair, but you can use the strategies I will show you also for stocks, and forex markets. To understand our strategy, you must understand the basic use of the awesome oscillator. Remember, what I told you at the start of the guide. When the awesome oscillator breaks above the zero line, it means the short-term momentum is increasing faster, and it shows that the bulls are gaining strength. Similarly, when the oscillator drops below the zero line, it shows that the short-term momentum is decreasing, and the bears are creating selling pressure.
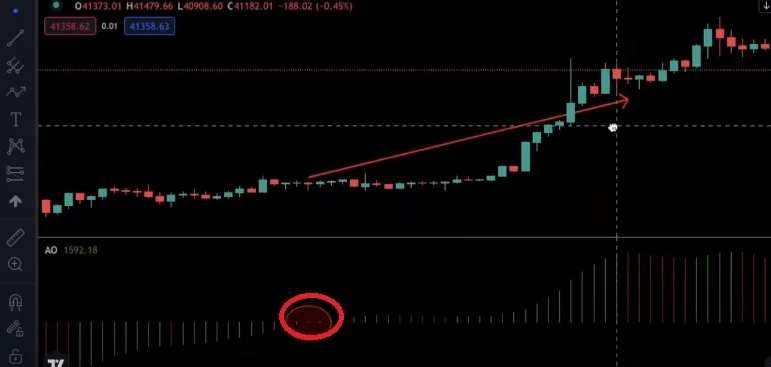
I think you can guess the main strategy that most of the traders use. It is called the zero-line crossover strategy, and basically, they buy each time when the oscillator breaks above the zero line, and they go short each time it drops below. It is the most commonly used awesome oscillator strategy. But there is a huge catch with this strategy.
Filter the signals to avoid false signals
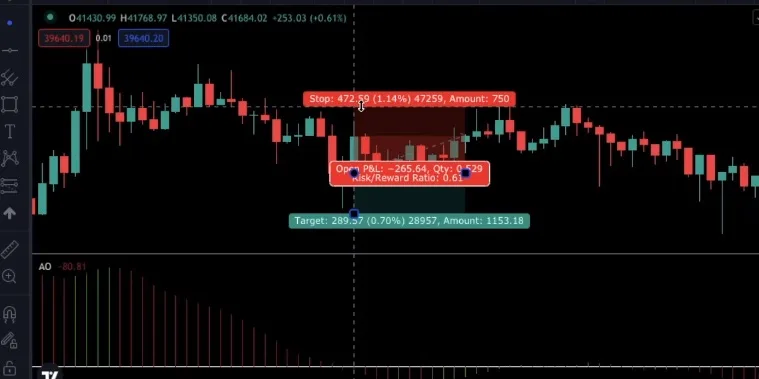
The awesome oscillator is a momentum indicator, and like most of the momentum indicators, it doesn’t work awesome in ranging markets. So you won’t be making much money if you stick with the regular zero-line cross strategy, because it generates many false signals during the ranging markets. So we must find a way to filter the signals. Since the awesome oscillator works better in trending markets, the easiest way to filter our entries is to determine the trend, and never trade against it. Look at the screenshot below:
Strategy One: Using EMA correctly
Determine the market trend using exponential moving average (EMA)
The easiest way to determine the trend is to use moving averages. So, I will add an exponential moving average to our chart. Before using the E.
For M.A., we have to change its settings. We use a 200 moving average in most of our strategies.
But, according to my backtests 100-period exponential moving average works best for this strategy, but don’t be shy to backtest for yourself. So we have to click the settings icon, and change the length to 100. To filter our entries, we will only look to buy, when the price is above the 100-period E.M.
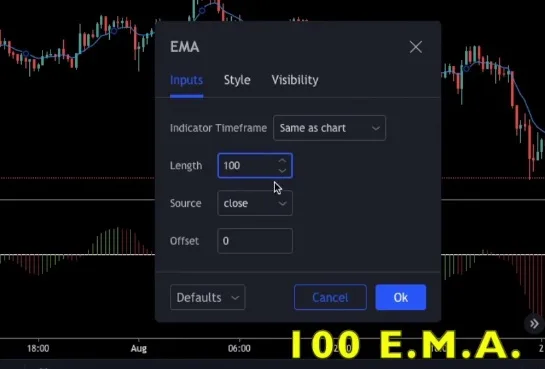
For A., and we will only look to go short, if it is below the moving average. With the help of the moving average, we will avoid trading against the trend. Don’t worry if you didn’t understand.
Examples:
I will show some examples now. You can see that price is above the moving average now, so we will only look to go long. We get our first entry here. As you see, the price breaks above at this candle, so we will open a position at the opening of the next candle. Check the screenshot:
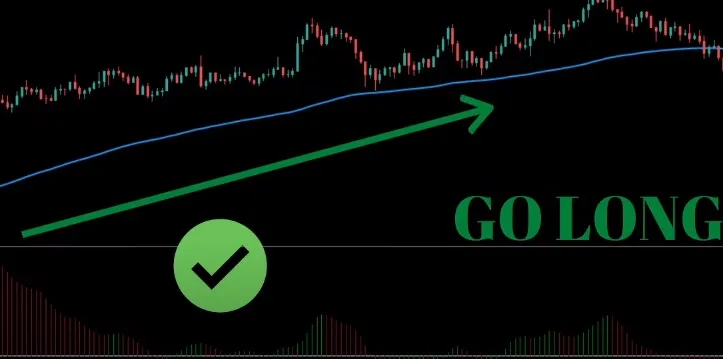
Use stop-losses
For putting stop-losses, there are many options, the most common way to do this is to use the ATR indicator. But in order to keep this strategy brief, I will put stop-losses below 0.75 percent below our entry. But keep in mind that it is not the most healthy way to put stop-losses, especially in volatile markets.
For the take-profit target, you can aim for a 1.5 risk-reward ratio. Our first entry was a winner, so we will continue to search for entries. The awesome oscillator drops below the zero line here, but we will avoid opening a position since there is a positive trend.
Instead, we will wait until it breaks above the zero line, and open a position there. Which happens here. As you see, this trade was a winner also. You can see 4 possible entries on the screen now, 3 of them were winners and one of them was a loss.
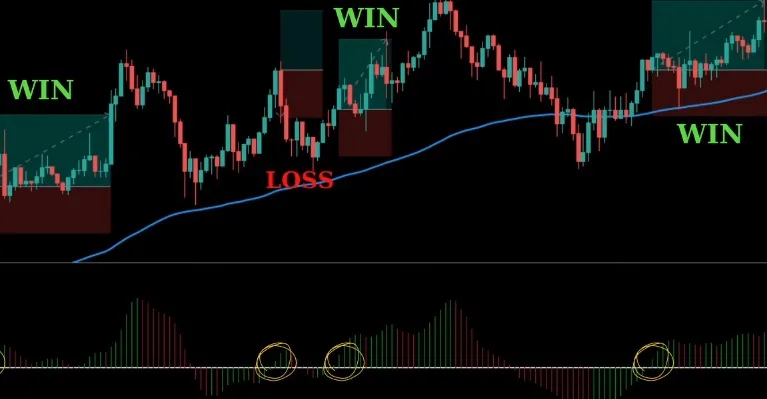
To increase the win rate you can confirm your entries with candlestick patterns. I think it was enough for long setups. I want to show you a short setup also before moving to the other strategy. You can see that the price is below the 100-period E.
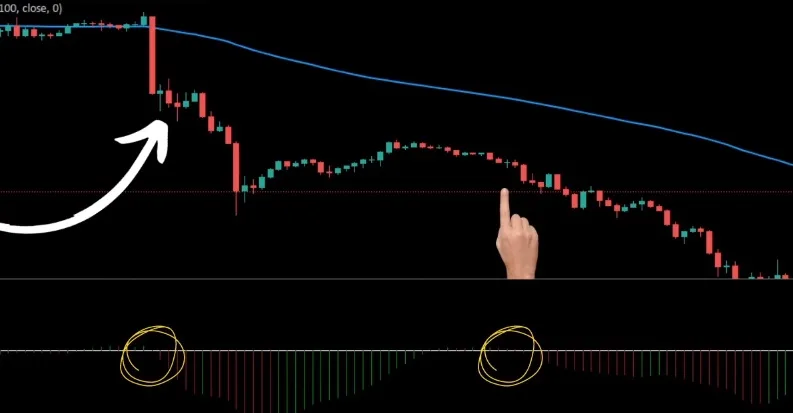
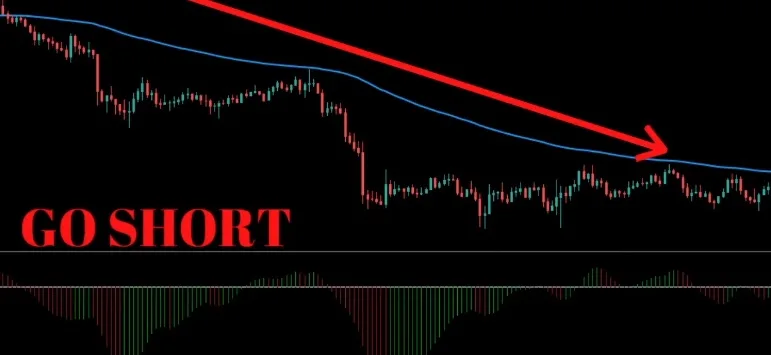
For M.A. now, so we will only look to go short. There are 2 possible entries on the chart now.
I will show you each of them before moving to the other strategy. Here in the first example, you can see that the awesome oscillator drops below the zero line. So we will open a short position at the opening of the next candle. I will put the stop-loss zero point 75% below the entry point again, but as I told you, it is not the best way to do it.
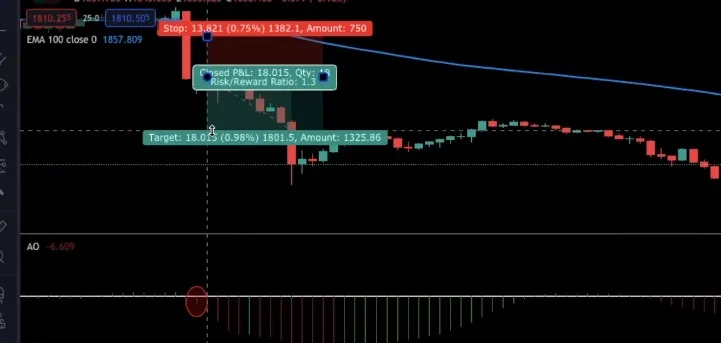
And I will aim for a 1.5 risk-reward ratio as well. Our first entry worked out well, so let’s move to the other one. Histogram breaks above the zero line here, but since the price is above the moving average, we will not open a long position.
We will go short as soon as the histogram drops below the zero line, which happens right there. So, I think it is enough for this strategy.
Strategy Two for using Awesome Oscillator
Let’s move to our second strategy, it is not as simple as the first one, but don’t worry, we will go step by step. Instead of the E.M.
For A., we will use moving average crossover this time. So, let’s add it to our chart. We will search for moving average cross and we will add the one on top by “Chart Art”.
We are going to make some changes, so you should click the settings icon here.
First, we are going to change the lengths of the 2 moving averages to 25 and 50. An then we are going to make some style changes.
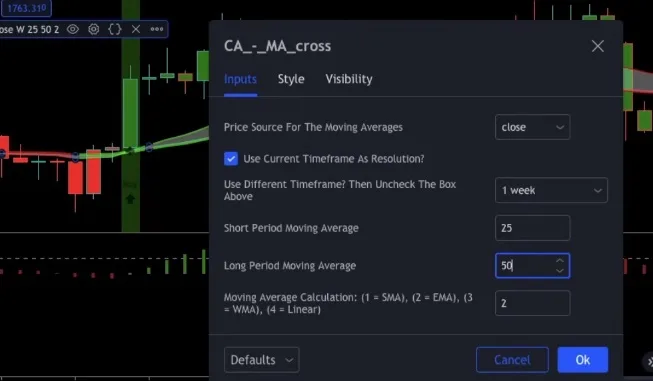
Actually, you don’t have to do the style changes. I change them so it will be easier to see. But you can use settings that you feel most comfortable with. But be sure that you change the length of the moving averages.
Our chart looks a little bit complicated this time, but don’t let it scare you. Because this strategy is also super simple like the first one. And I will explain it with examples so you will understand better. The moving average crossover indicator is super easy to read, because it tells you when to open a position.
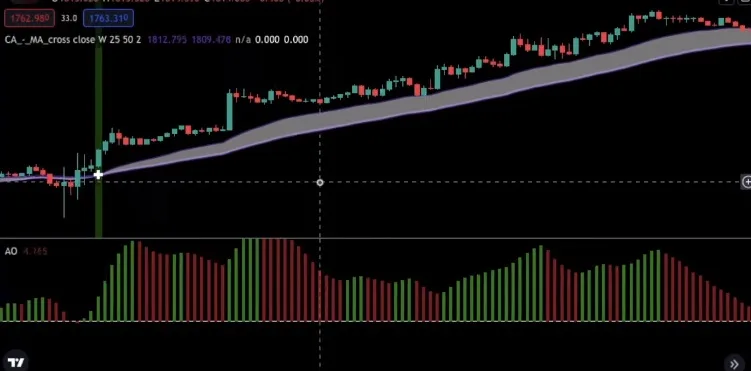
You can see that, it displays buy and sell alerts regularly at the crossover point. However, it doesn’t display a signal each time a crossover occurs. So, we will open positions only if the indicator shows a signal. You might ask yourself, how do we combine this strategy with the awesome oscillator.
This time, we will use the awesome oscillator to confirm our entries. So, with the help of the awesome oscillator, we will increase the win rate. Let me show you how. Remember what I’ve told you at the beginning of this guide.
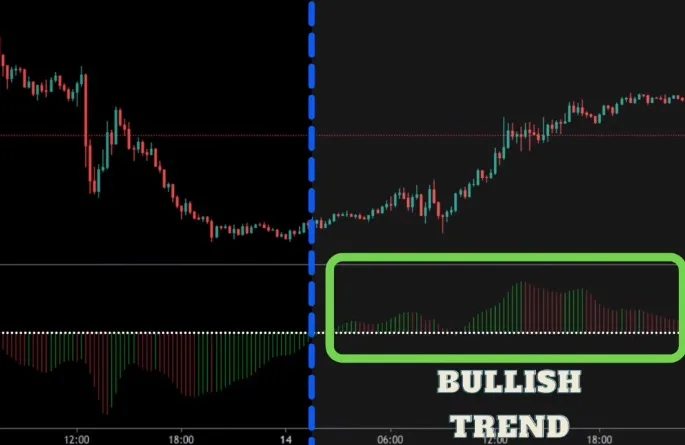
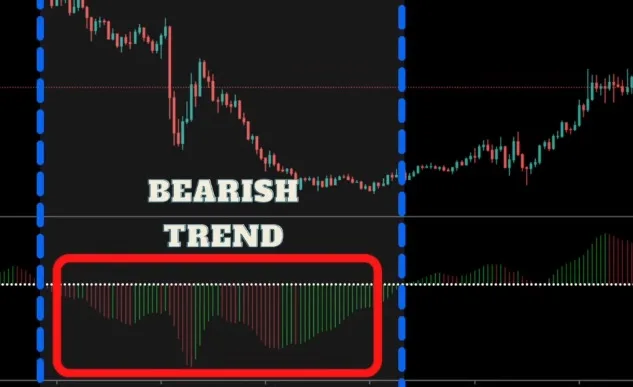
The awesome oscillator shows us the momentum. It indicates a possible bullish trend if the histogram is above the zero line, and if it is below the line, it shows a possible bearish trend. To filter our entries, we want both the momentum and the trend on our side. We will only take the long signals if the histogram is above the zero line, and we will add a second confirmation this time.
The color of the bars in the histogram must be green while we are opening a long position. Because it indicates that the trend is gaining momentum. Similarly, while opening a short position, we must be sure that the histogram is below the zero line, and bars must be red. Don’t worry if it sounded complicated.
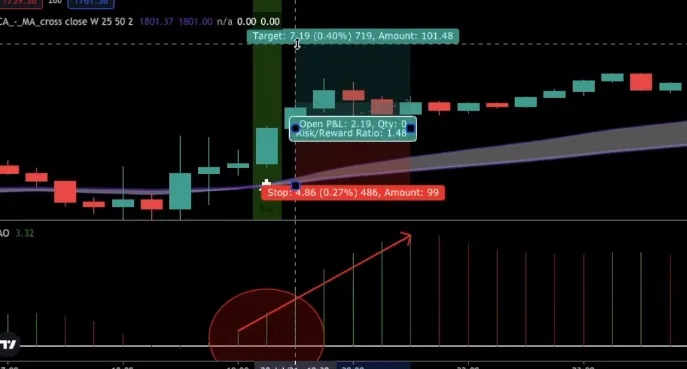
I will show both long and short examples now, so you will understand better. Here you can see that the moving average cross indicator gives a buy signal. But before opening a position we should check two things.
- First, the histogram must be above the zero line.
- And second, since we want strong momentum, the bars of the histogram must be green. This example satisfies both of our rules. So, I will open a long position. There are 2 possible ways to put stop-losses in this strategy.
You can either use the ATR indicator, or you can put it slightly below the crossover point. Because as you know, moving averages tend to act as support or resistance. And for the take-profit target, you can aim for a 1.5 risk-reward ratio, just like the first strategy.
Before revealing the cheat sheet, I want to show you a short setup too. Here you can see that the indicator gives a sell signal. So, we must check the awesome oscillator before going short.
- First, the histogram must be below the zero line, and
- Second, bars must be red.
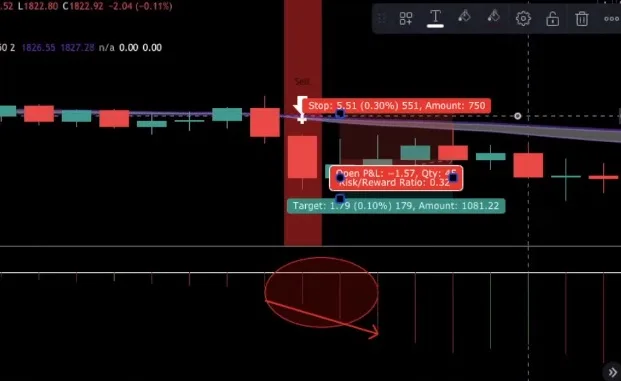
As you see, this setup satisfies both of our rules. So, I will open a short position, with a stop-loss just a little bit above the moving averages. Just like the long setup, the risk-reward ratio will be 2. This trade was a winner as well.
Conclusion
I think it is enough for this strategy. Now it is time for the cheat sheet. You can write that down or take a screenshot to use it while trading. Please be sure that you backtest every strategy before trading it with real money.
Cheat sheet
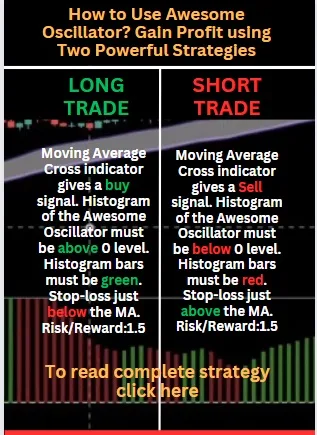
That way you will know the win rate, and you will be more confident while trading. The awesome oscillator is not one of my favorite indicators, but with enough backtesting, it can be as profitable as other indicators. So if you want to trade with it, be sure you test it before. I hope you understood both of the strategies well, but don’t forget to subscribe our newsletter.
If you need more tips and guide on trading, you can check out the following posts:
How to Be Successful on Olymp Trade?
How to Start Trading in Olymp Trade? 90% Trade Profit
If you enjoyed reading this guide and found it useful for your trade, please share it with others. So that they also can be benefited.
Please follow us on Facebook, Instagram, Pinterest and subscribe to our YouTube Channel.
Thanks for visiting us. Please visit again.

